
Monday, October 5, 2026

Traditional Enterprises Deploy AI at Production Scale, Moving Beyond Pilot Programs

Copart's vehicle auction platform deployed AI enterprise-wide, marking a shift from experimental projects to core operations. Traditional industries now implement vertical-specific AI solutions at scale, with confidence levels reaching 82% for operational deployment.

Traditional Enterprises Deploy AI at Production Scale, Moving Beyond Pilot Programs
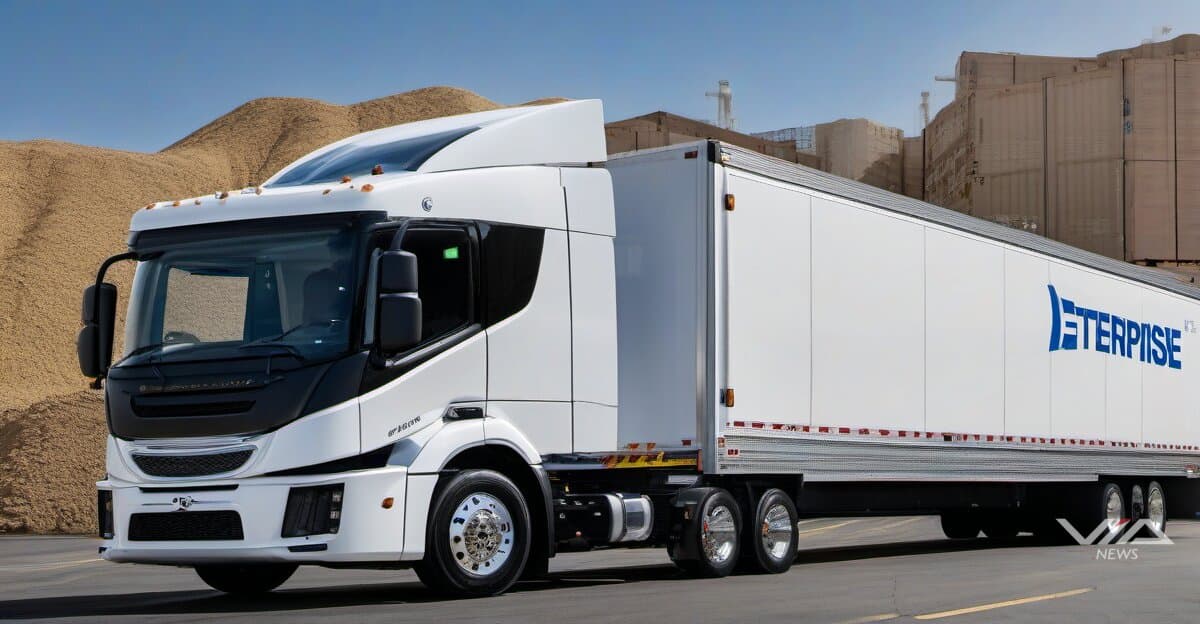
Image generated by AI for illustrative purposes. Not actual footage or photography from the reported events.
Loading stream...

Copart deployed AI across its vehicle auction platform operations, moving from pilot testing to full production scale. The company's implementation represents a broader pattern: traditional enterprises now deploy AI as core operational infrastructure rather than experimental technology.

Enterprise AI adoption accelerated in logistics, supply chain, and asset management sectors. Companies report AI deployments in earnings calls as operational capabilities, not research initiatives. The shift indicates 6-12 month acceleration timelines for vertical-specific implementations.

Vehicle auction platforms process thousands of transactions daily, requiring real-time pricing, damage assessment, and inventory management. Copart's AI deployment handles these operations at scale, demonstrating production-ready capabilities in high-volume environments.

Traditional industries previously lagged tech companies in AI adoption by 18-24 months. That gap narrowed to 6-9 months as vertical-specific solutions matured. Industries with clear data structures and repetitive processes show fastest adoption rates.

Enterprise deployments differ from consumer AI applications. Companies prioritize accuracy, auditability, and integration with existing systems over cutting-edge features. Production deployments require 99%+ uptime and clear ROI metrics within 12 months.

Logistics and supply chain operations generate massive structured datasets ideal for AI processing. Vehicle auctions, freight routing, and warehouse management share common patterns: high-volume decisions, time-sensitive operations, and quantifiable outcomes.

CFOs now expect AI deployment roadmaps during budget cycles. Questions shifted from "should we invest in AI?" to "which operations deploy first?" Companies allocate 15-20% of technology budgets to AI infrastructure, up from 5-8% in 2024.

The pattern repeats across sectors. Manufacturing, healthcare logistics, and commercial real estate deploy AI for specific operational functions. Each vertical develops specialized solutions rather than adopting generic platforms.

Next 12 months will show which industries convert pilots to production fastest. Early indicators point to asset-heavy industries with clear data lineage and regulatory frameworks supporting automated decision-making.

What we know · the intelligence behind this page
Live from the substrate
What we're seeing
Pharma Pipeline Catalysts and M&A Heat Up as AI-Designed Drugs Enter the Clinic
Late-September 2026 brought a dense run of clinical readouts: Novo Nordisk's CagriSema data at EASD, Lilly's ADtouch results for EBGLYSS, and Merck's tulisokibart Phase 2b result. Lilly's $2.9B Merida Biosciences acquisition and the 2026-11-14 FDA PDUFA date for ivonescimab sit alongside these as the main deal and regulatory events. AI-designed drugs such as rentosertib, and speculative AI-linked trial ventures such as QAIAx, are moving from hype toward clinical validation. Broader AI-sector regulatory and legal friction (Tesla Cybercab probe, xAI Minnesota ruling, OpenAI lawsuits) shows rising scrutiny that could spill into AI-driven healthcare.
Our read on the data ›
Signals we're tracking
EPKINLY Regulatory-Clinical Success Cascade
High probability of expanded label indications, additional combination approvals, and competitive positioning strength in follicular lymphoma market. Predicts positive commercial uptake and potential accelerated review for related indications.
Patterns we're watching ›
Where sources disagree
ING Group
Both facts record the same metric (shares_outstanding) for ING Group at the identical observation date (2025-12-31). FACT A states 2,902,437,688 shares; FACT B states 2,902 million shares (2,902,000,000). The difference is 437,688 shares (~0.015%). This is a genuine value conflict, though the discrepancy appears to result from FACT B rounding to the nearest million while FACT A provides the precise count.
We flag conflicts openly ›
Recently verified
✓ Checked against the original source
4,985
facts traced to their source — and we flag the ones that don't hold up.
101 entities tracked4,985 facts checked against source5,340 source documents archived
Query this data → isubstrate.com